![[Nov2022]_T_Y 2.0 – Black Transparent@2x](https://timingandyou.com/core/wp-content/uploads/2022/12/Nov2022_T_Y-2.0-Black-Transparent@2x.png)

The Next Shoes To Drop – U.S. Commercial Real Estate and U.S. Regional Banks
June 1, 2023
August 2023 T&Y RRI™ (11/9/2023)
September 11, 2023
** Please note that any information shared in this private blog is NOT to be regarded as an advice or a recommendation, it is meant for EDUCATIONAL AND INFORMATION PURPOSES only and it does not constitute an investment advice, an offer or solicitation to purchase or sell the investment asset classes mentioned. **
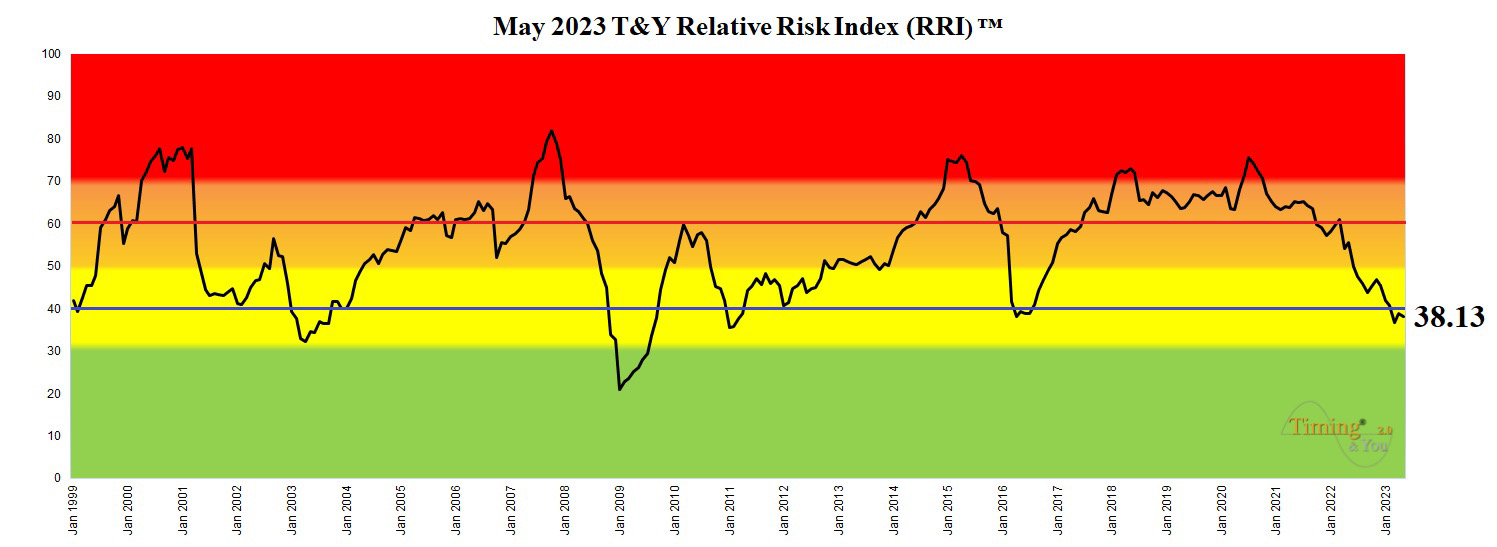
T&Y Relative Risk Index (RRI)™ is a proprietary 3-dimensional stock market barometer which analyzes 14 different cyclical, technical, financial, credit, and economic indicators and composes of a correlation of 47 individual sub-models to tell us at a glance whether the U.S. STOCK MARKET environment is bullish, bearish, or somewhere in between. It is PROBABLY the first in the world that combines Cycle Analysis (40%), Technical Analysis (30%) and Fundamental Analysis (30%) parameters to give a holistic RISK-REWARD assessment of the U.S. stock market on a monthly basis.
May 2023 T&Y RRI™ stands at 38.13%. It has been under the 40% level for the past 3 months.
As a recap, below are the 14 major components of T&Y RRI™:
40% Cycle Analysis (CA) Components
1) W.D. Gann Financial Time Table
2) 3.5-Year (41-month) Cyclical Stock Market Cycle
3) 17.5 – 21 Year Secular Stock Market Cycle
4) 30-Month Fixed Stock Market Cycle
30% Technical Analysis (TA) Components
1) Wilshire 5000 Monthly MACD-Histogram
2) XLY/XLP Ratio
3) NYSE Percentage of Stocks Above 200 Day Moving Average (NYA200R)
4) HYG/IEF Ratio
5) DT7 Buy/Sell Ratio
30% Fundamental Analysis (FA) Components
1) Well Fargo Recession Indicator
2) Oil Indicator
3) Economic Cycle Research Institute Weekly Leading Index (WLI)
4) Conference Board Leading Economic Index (LEI)
5) Off-Peak-Mode Timing & You Business Cycle Indicator (BCIp)
** Please note that any information shared in this private blog is NOT to be regarded as an advice or a recommendation, it is meant for EDUCATIONAL AND INFORMATION PURPOSES only and it does not constitute an investment advice, an offer or solicitation to purchase or sell the investment asset classes mentioned. **